Testing and Simulation!
This page presents a visual simulation of the raster and Lissajous scan patterns generated by our MEMS-based AR projection system. The results of different frequency configurations and canvas sizes are displayed through static images.
Raster Scan Simulation
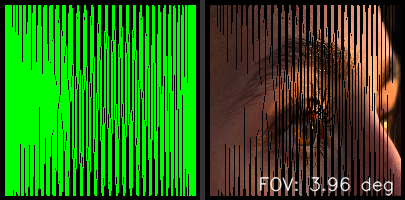
Raster scanning is a scanning method that traces the image line by line, from left to right and top to bottom. Although our system is MEMS-based and can implement more complex patterns, visualizing the basic concept is useful for comparison.
Lissajous Figures Simulation
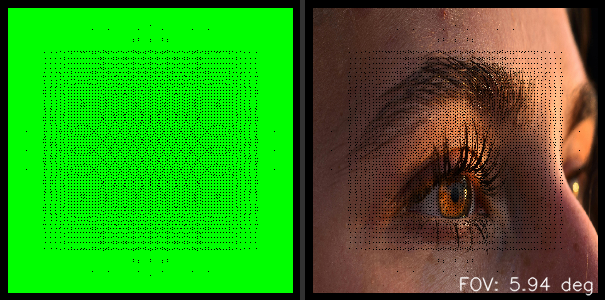
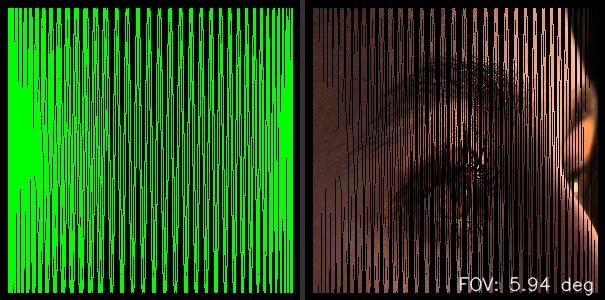
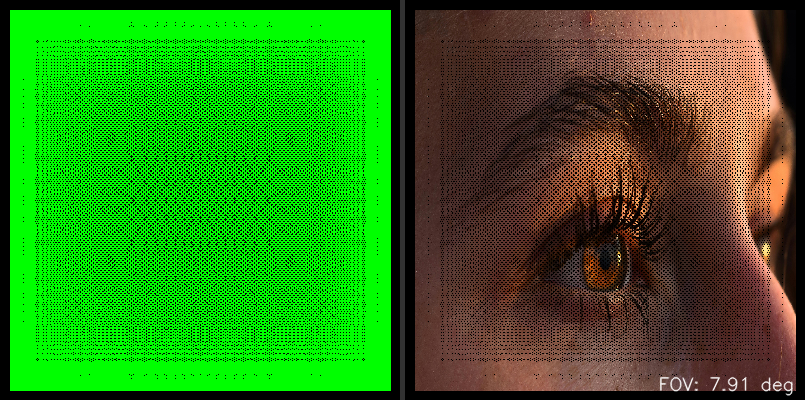
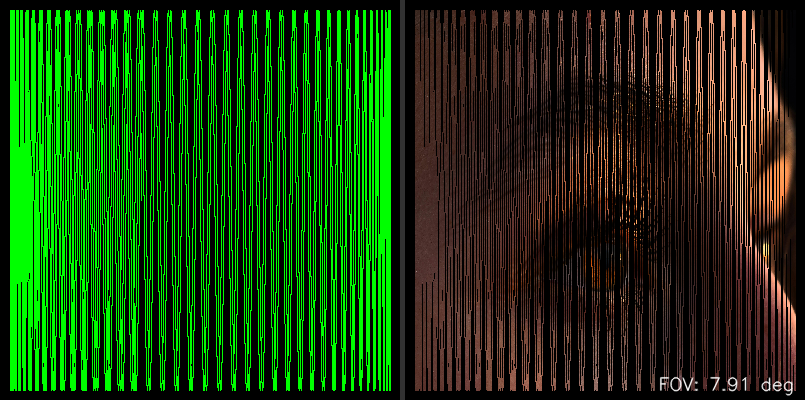
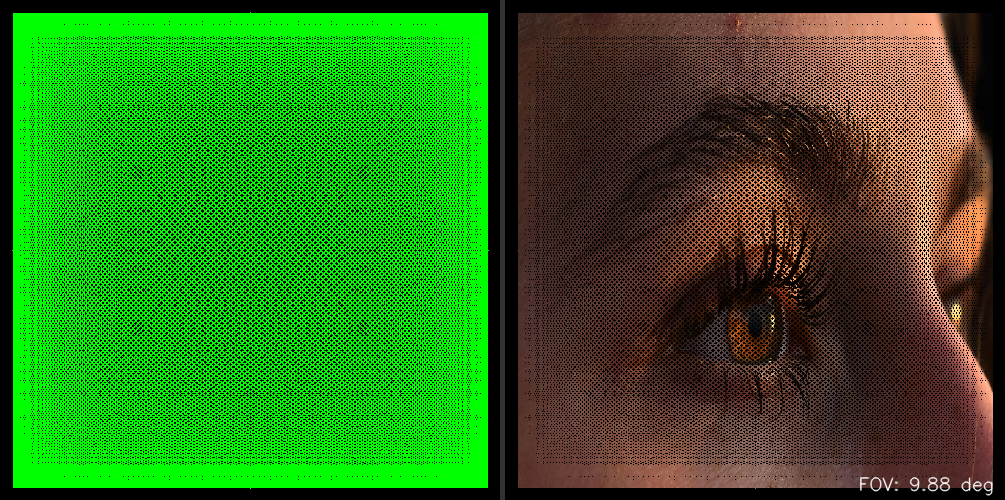
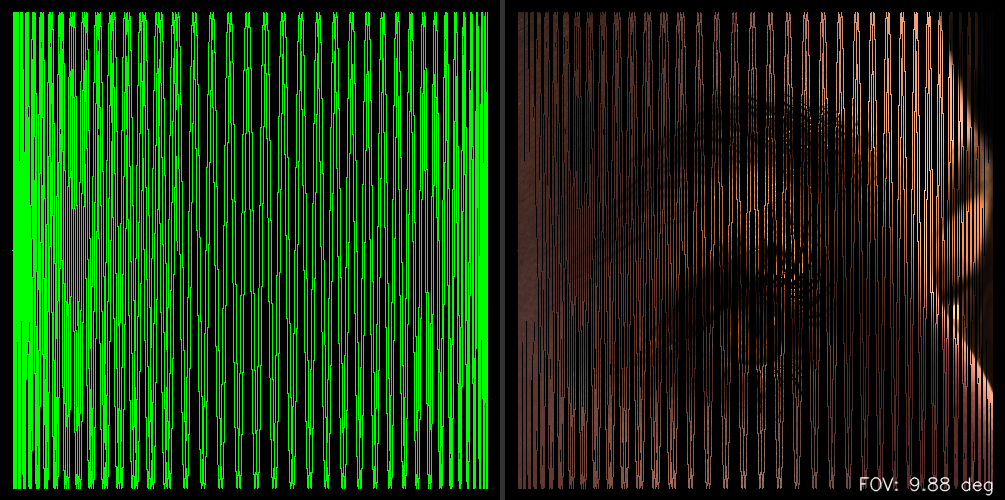
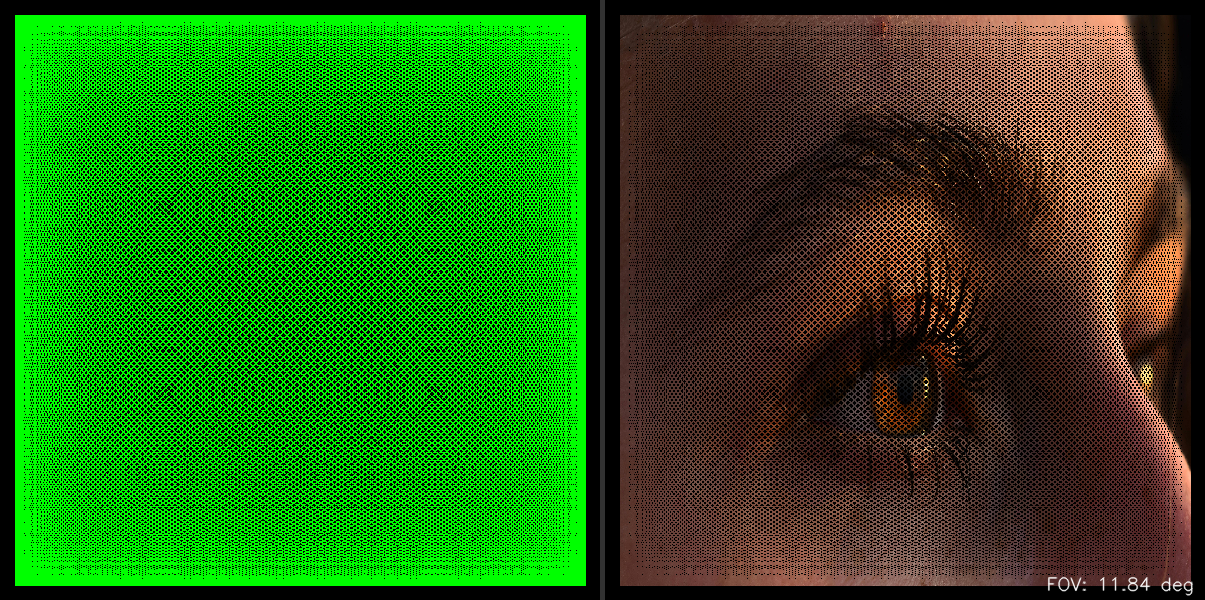
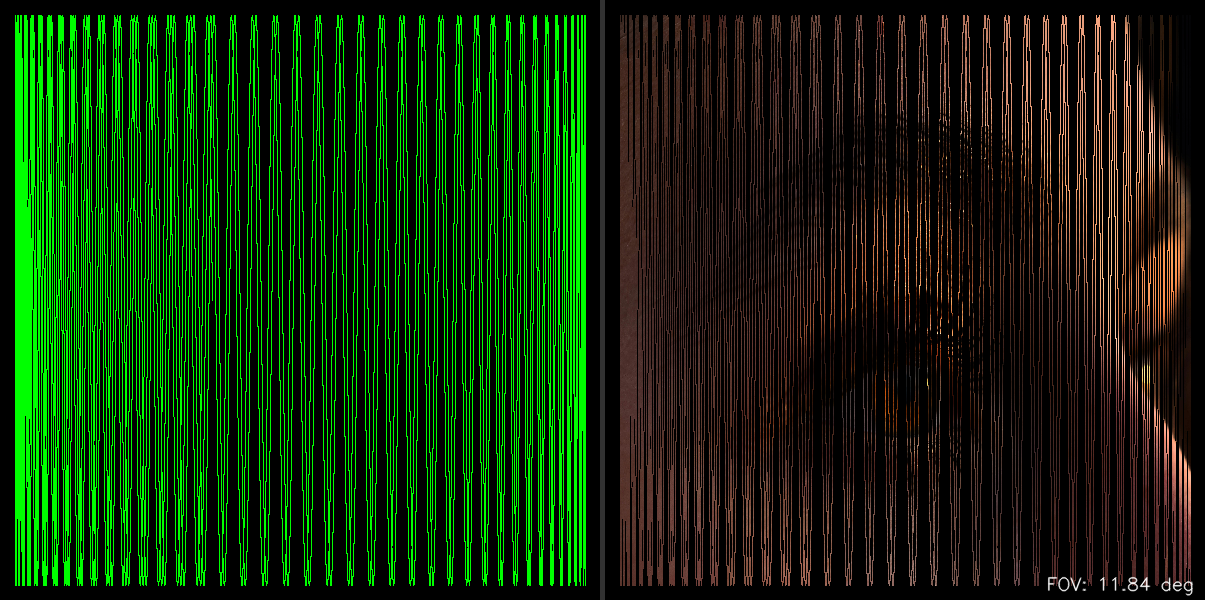
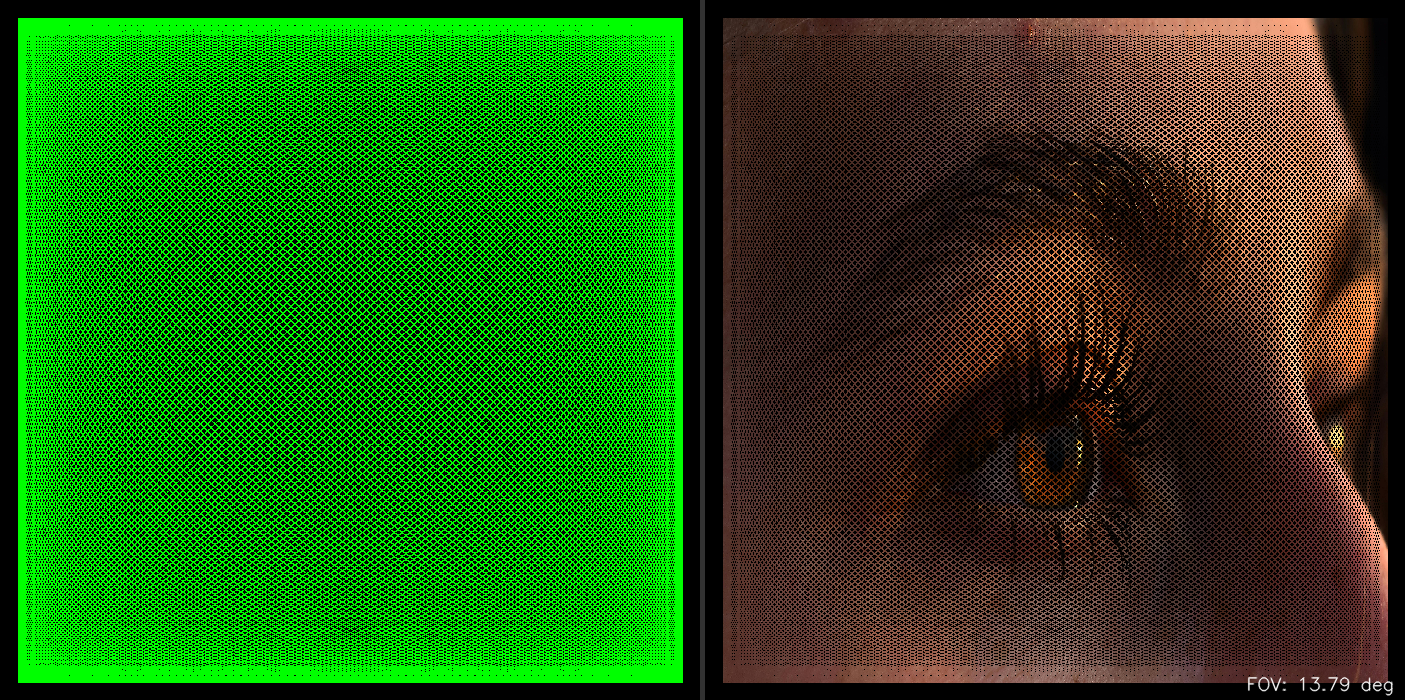
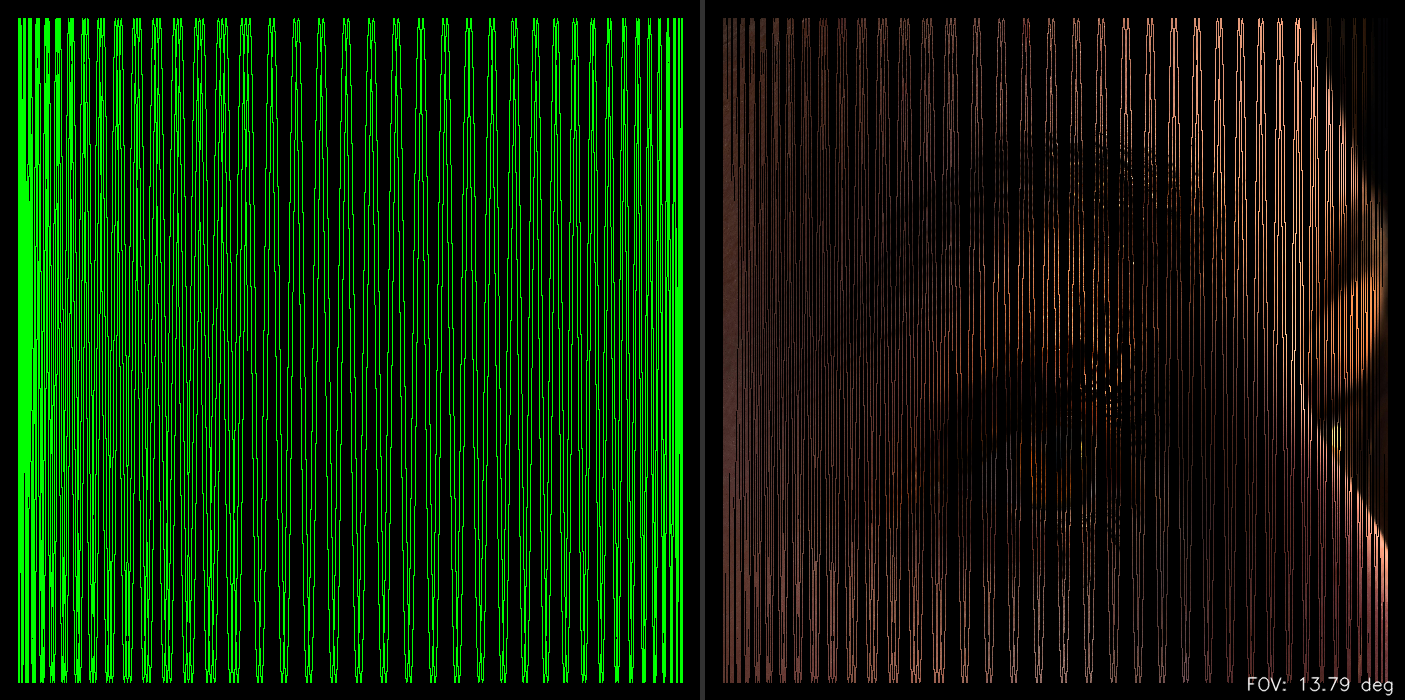
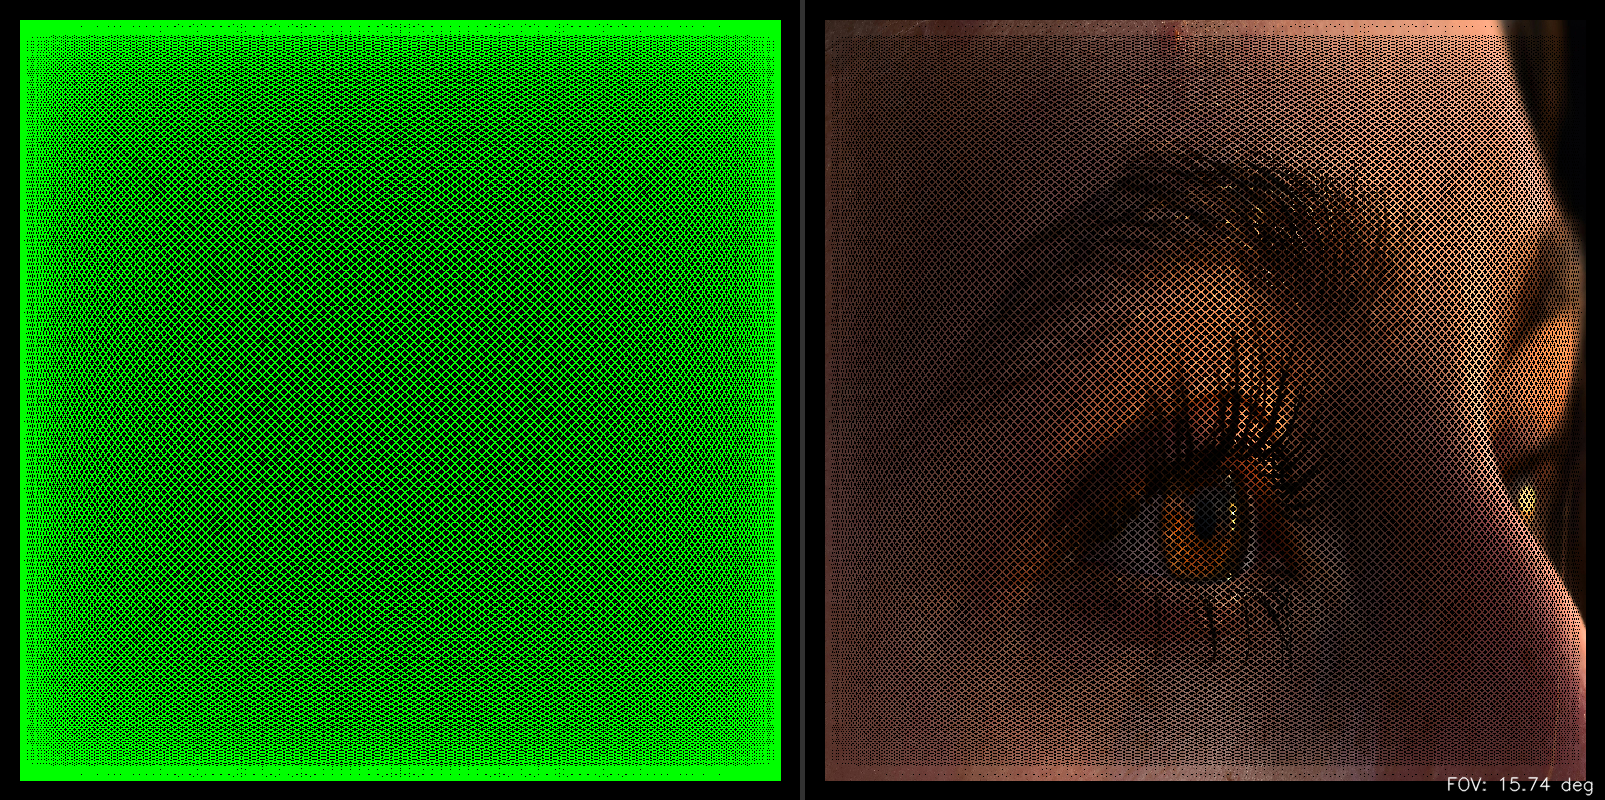
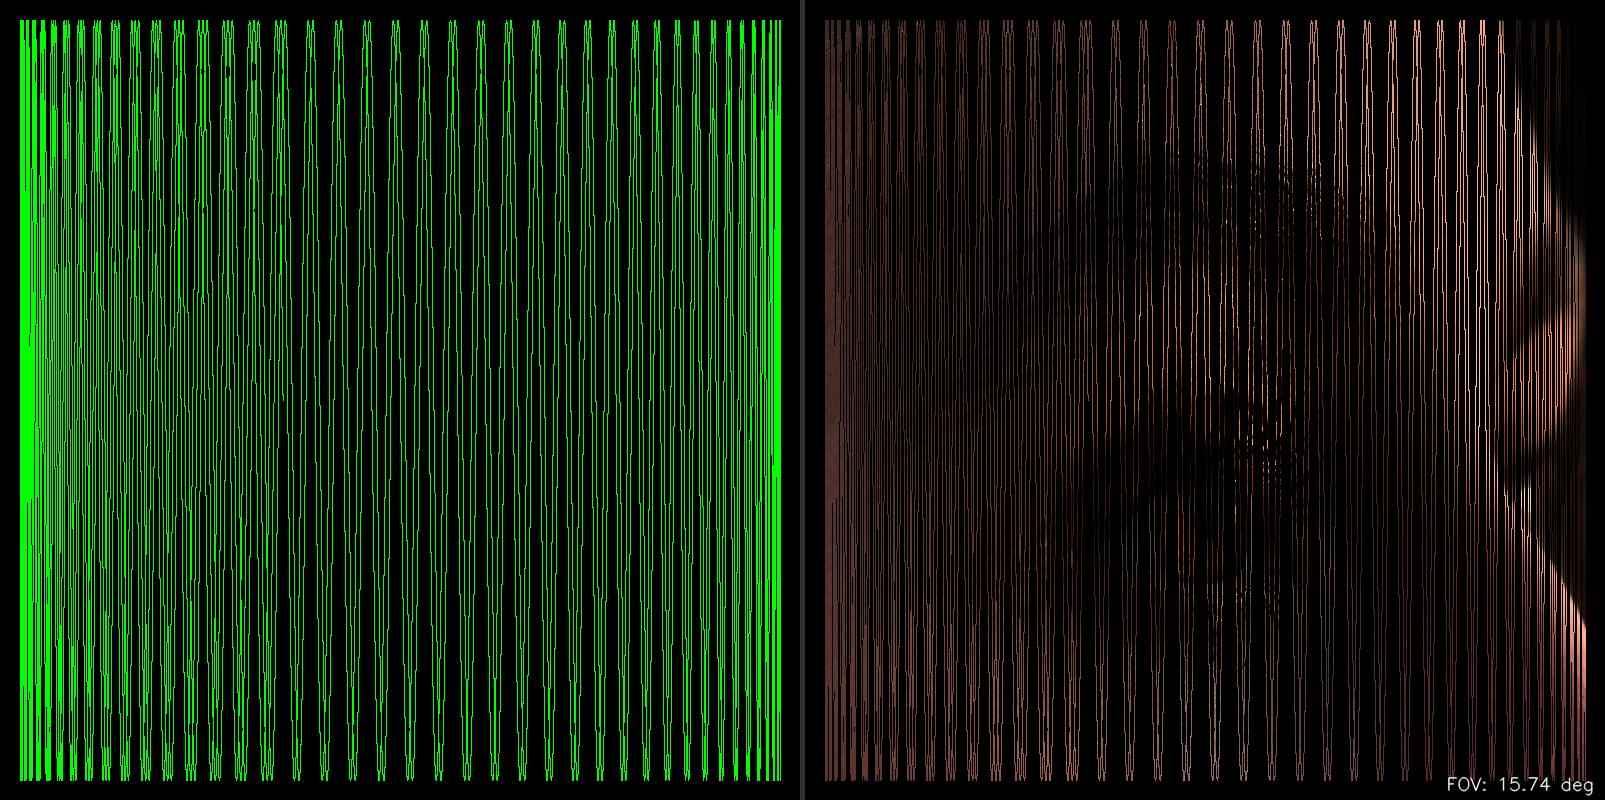
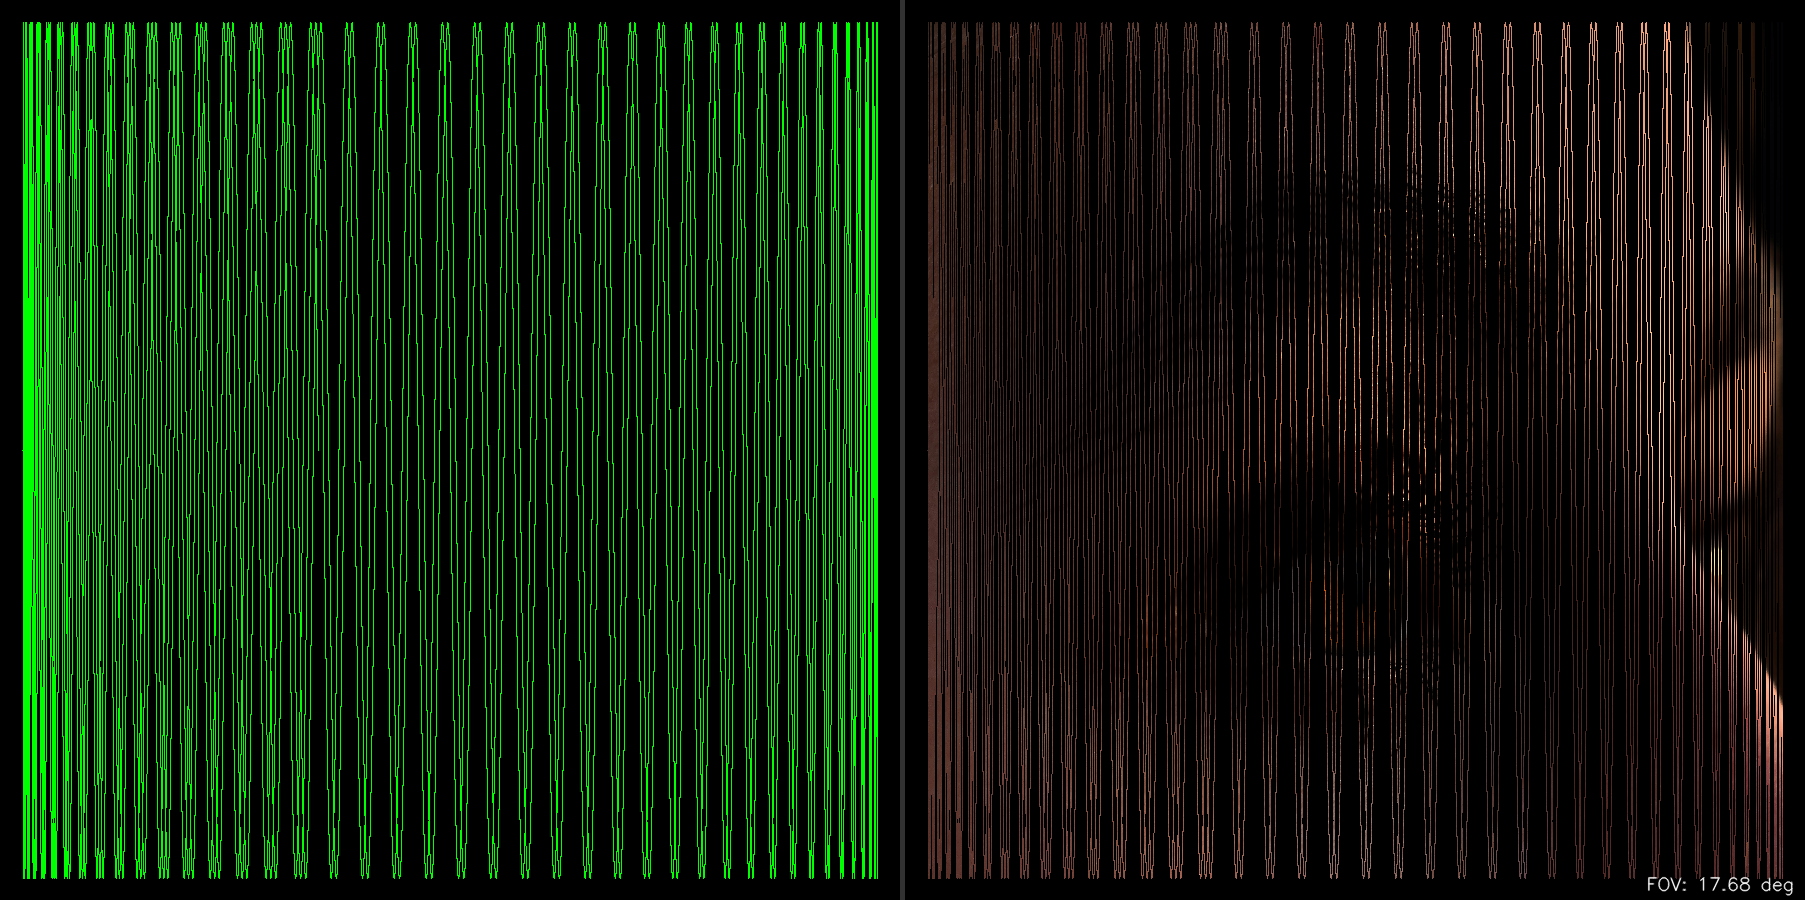
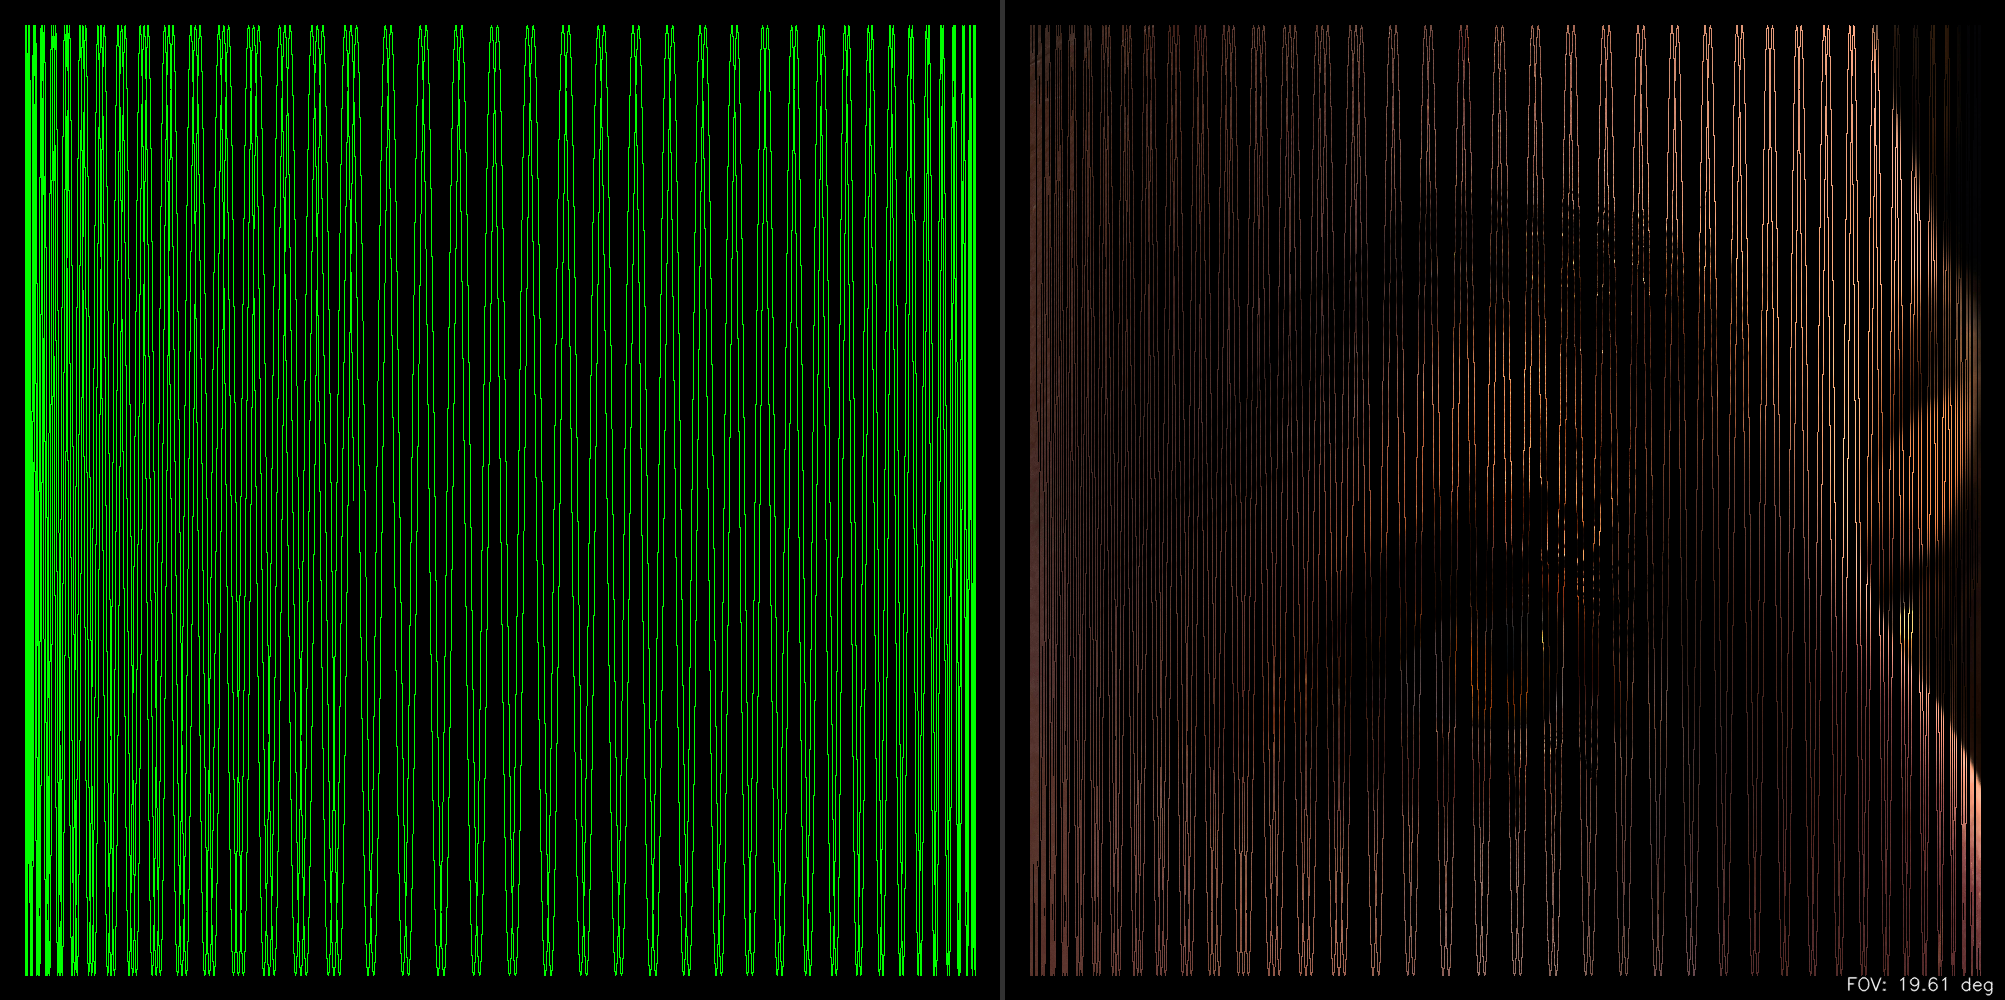
Lissajous figures are parametric curves generated by the combination of two perpendicular sinusoidal oscillations. The shape of the figure depends on the ratio between the frequencies of the two oscillations and their phase difference. This simulation explores the effect of different frequencies on canvases of various sizes.
Results for Different Canvas Sizes and Frequencies
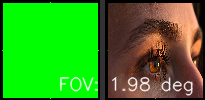
Below are the simulation results for different canvas sizes (from 100px to 1000px) and two pairs of frequencies (fx=1410.0 Hz, fy=1310.0 Hz and fx=12.0 Hz, fy=1000.0 Hz).
Results for Different Canvas Sizes and Frequencies
Below are the simulation results for different canvas sizes (from 100px to 1000px) and two pairs of frequencies (fx=1410.0 Hz, fy=1310.0 Hz and fx=12.0 Hz, fy=1000.0 Hz).
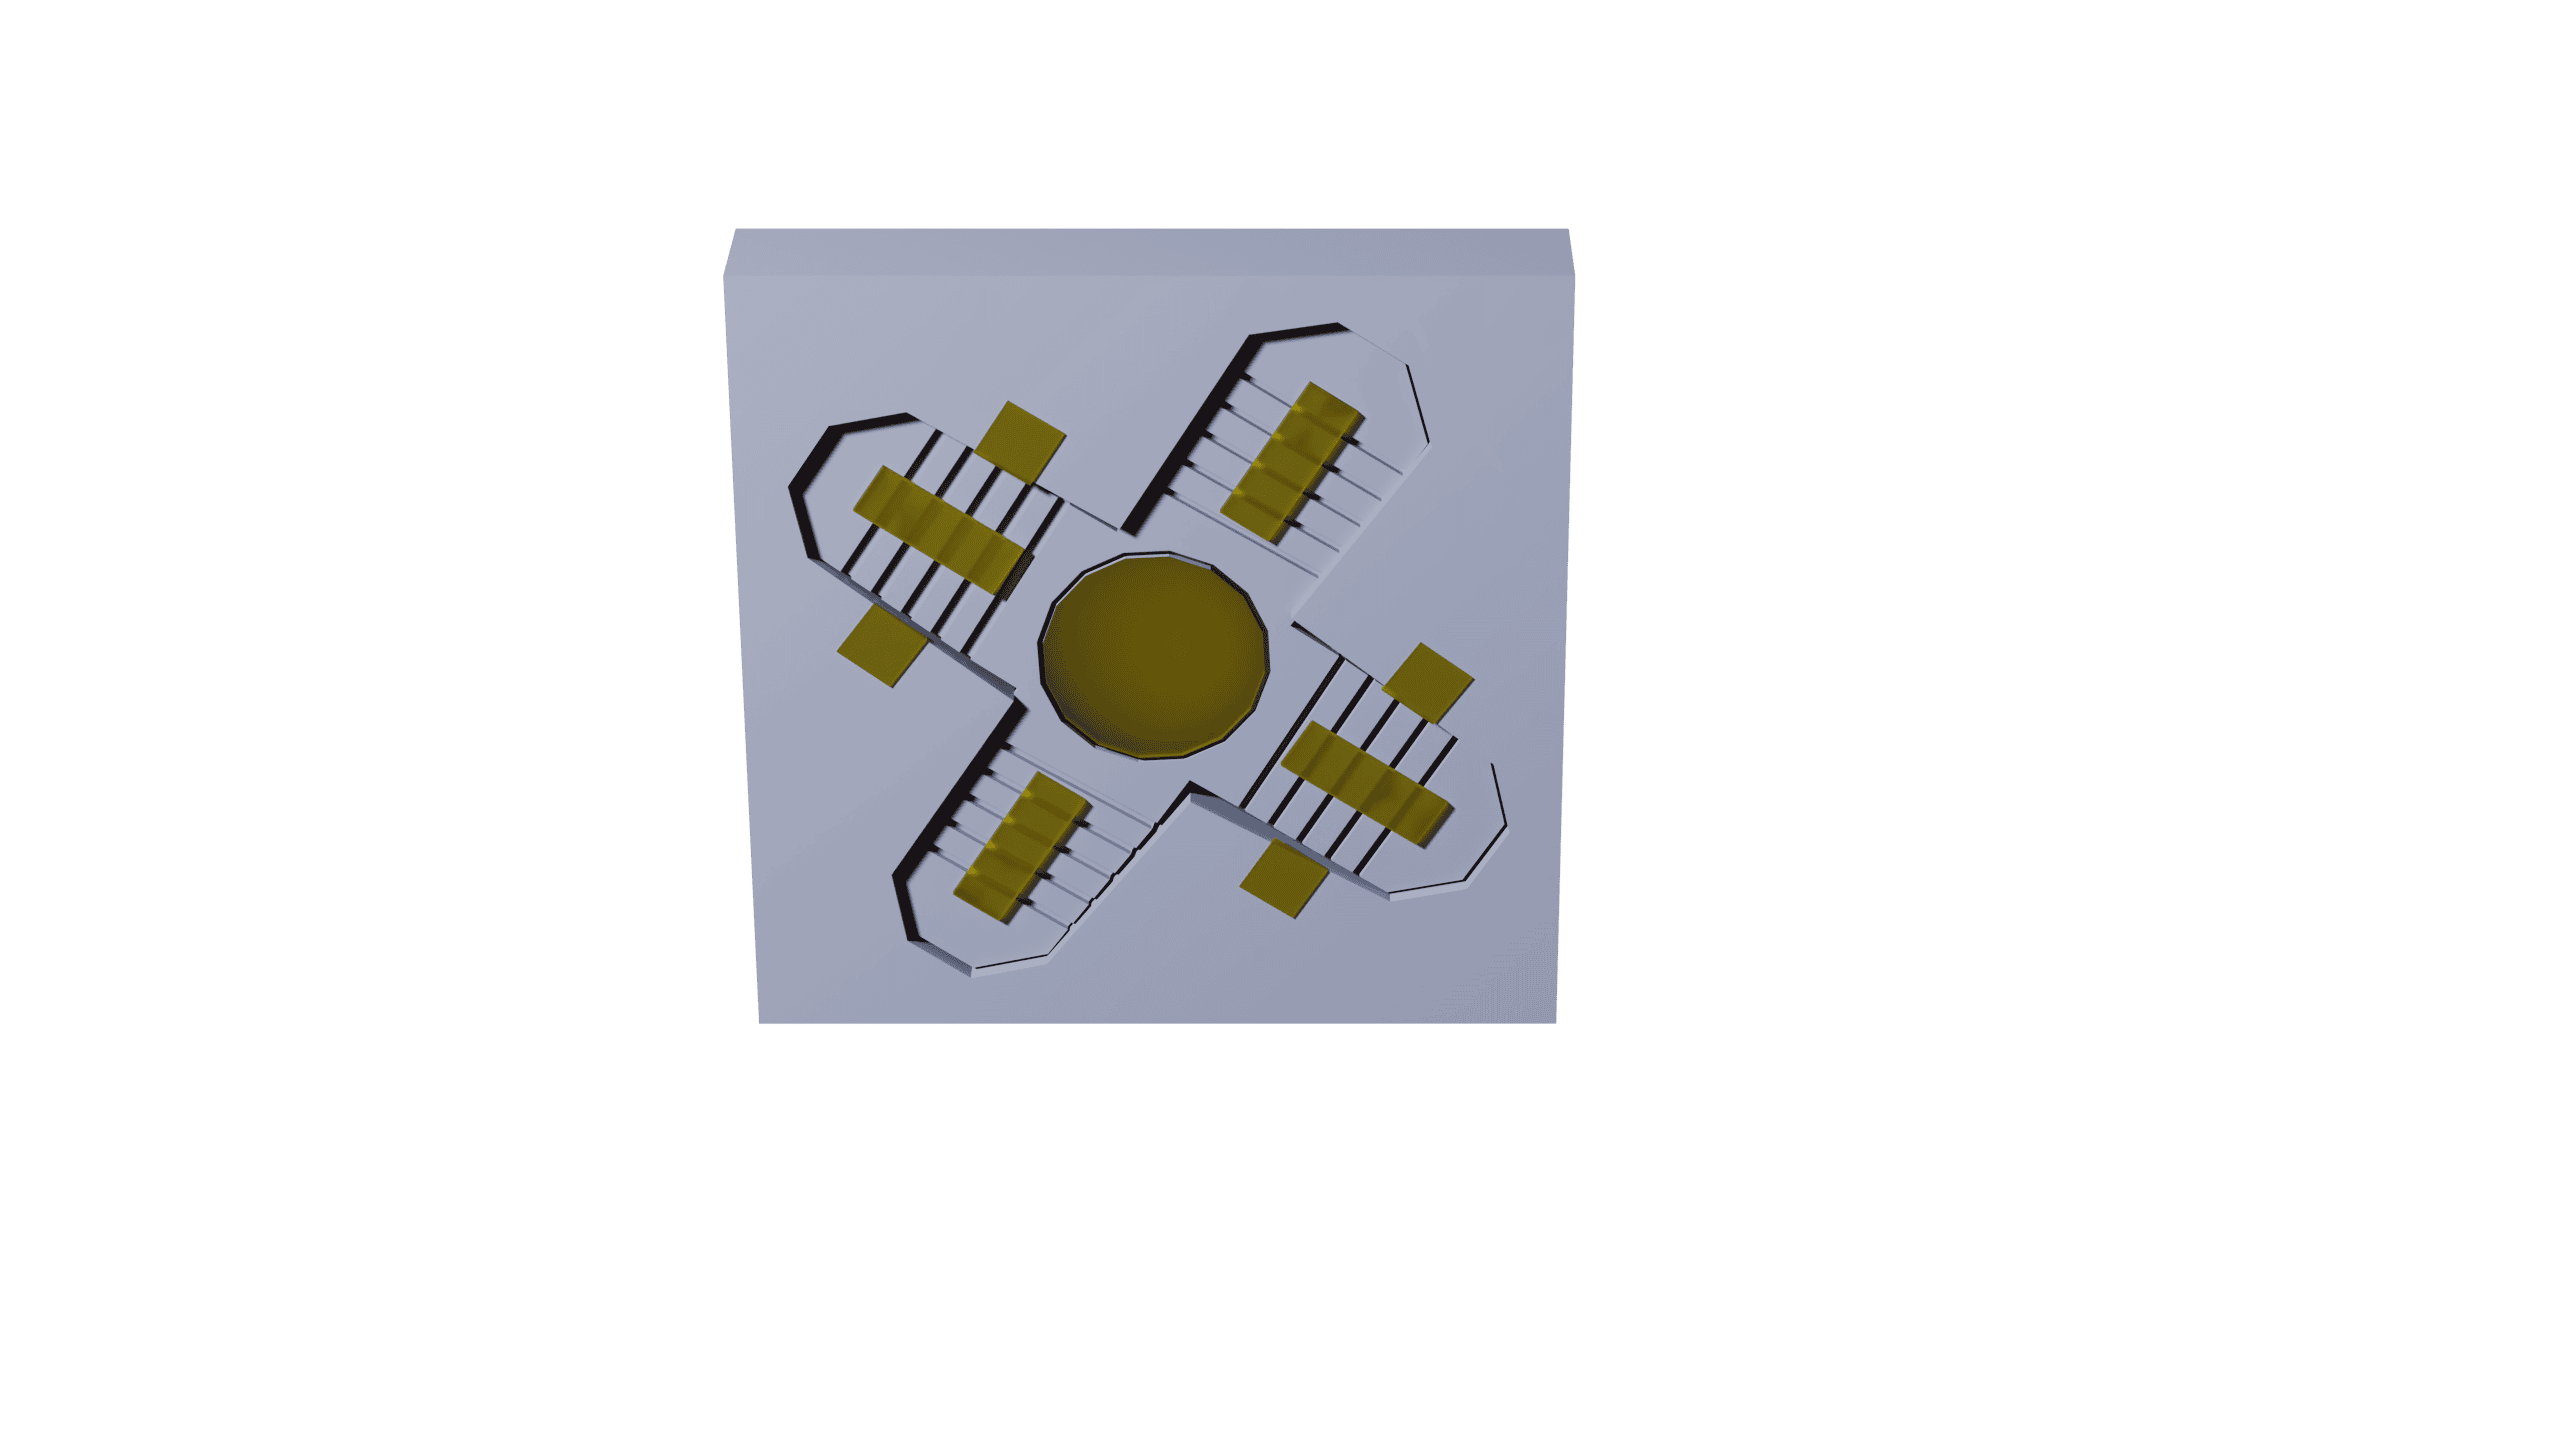
This using a single “micro” mirror typical MEMS
Canvas 100x100 Pixel:
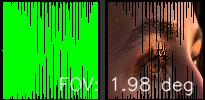
Canvas 200x200 Pixel:
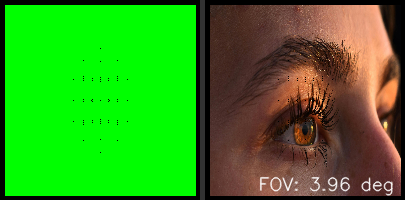
Canvas 300x300 Pixel:
Canvas 400x400 Pixel:
Canvas 500x500 Pixel:
Canvas 600x600 Pixel:
Canvas 700x700 Pixel:
Canvas 800x800 Pixel:
Canvas 900x900 Pixel:

Canvas 1000x1000 Pixel:

By clicking on the links above, you can view the images representing the patterns generated by the simulation for the different configurations. By observing these images, you can get an idea of how the frequencies and canvas resolution influence the shape and complexity of the Lissajous figures projected by our MEMS system.